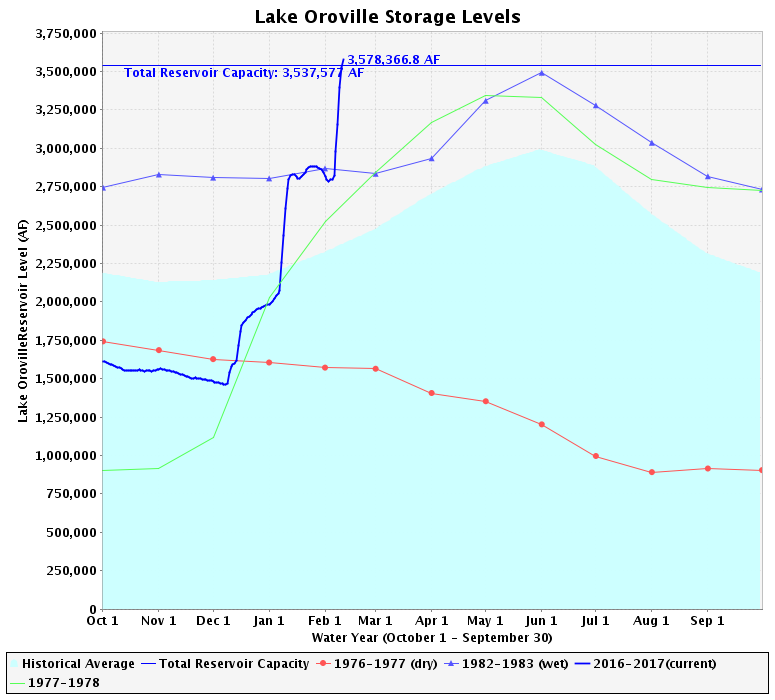
No, I don’t mean — at least, not directly — the current problems with the concrete and emergency spillways, nor the evacuation. I mean the chart above.
Look at that chart. The solid color represents the historical average of the amount of water in Lake Oroville. The sharply rising blue line represents the current (2016-2017) volume of Lake Oroville. The straight blue line across the top represents the capacity of Lake Oroville. Lake Oroville is currently at 101% of capacity, which is why it’s having the spillway problems that it is.
Now, look again.
Lake Oroville is currently at 101% of capacity. But historically, at this point of the year (mid-February), it’s only at about 67% of capacity and 80% of what its peak will be for the year, typically around the start of June. The snowpack in the Sierras massively increased last month and is currently at 150%-200% of normal for this date. Also, several days of rain are in the forecast, starting on Wednesday.
Again, note the sharp increases in water volume over the past two months, as opposed to historical patterns. When the rain starts to fall, and the snow starts to melt, where is all that water going to go? Lake Oroville is full and will likely be for months to come. All that extra water coming in has got to go somewhere.
UPDATE: Found this footage that shows the ’emergency’ spillway in action. The concern is that if too much water goes over the emergency spillway, it could erode the ground below it and cause the emergency spillway to collapse. Look at the size of that wall, and try to imagine what would happen if any part of that started to fail.
JUST IN: Authorities order residents in low-lying areas of Oroville, Calif., to evacuate as dam is predicted to fail https://t.co/2x3ZloKOqw pic.twitter.com/UVXxgiHMWj
— ABC News (@ABC) February 13, 2017
